Solar electric 6.5kw expanded to 12.3kw

  • Active since 1995, Hearth.com is THE place on the internet for free information and advice about wood stoves, pellet stoves and other energy saving equipment.

    We strive to provide opinions, articles, discussions and history related to Hearth Products and in a more general sense, energy issues.

    We promote the EFFICIENT, RESPONSIBLE, CLEAN and SAFE use of all fuels, whether renewable or fossil.
Have you used this site to see the sun zenith at your location? Type in the address and date.
http://www.solartopo.com/solar-orbit.htm

I have about a 6 week period before and after the winter solstice when I get shading from trees. On Nov 10 the sun zenith is 25.96 degrees, today (Nov 24) it is 22.57 degrees, and on Dec 22 it is 19.64 degrees. Similarly, Jan 22 - 23.16 degrees, and Feb 4 - 26.54 degrees. The shading is nearly all in the morning, until about 10:00 - 10:30am within this period. While there is shading, the sun angle is so low that the shading has little impact on daily production.
upload_2015-11-24_4-20-12.png
 
Last edited by a moderator:
Dec 2015 likely has been about the cloudiest month ever.

upload_2016-1-1_9-57-30.png

Total kwh for the month only 309.74 against a predicted average of 996 kwh.
 
Last edited by a moderator:
We had 3 sunny days here in December. 2nd rainiest on record. I don't even look at our pathetic Dec. production. Being at high latitude on the north slope of the hill really puts the sun at a low angle. It gets clipped by tall trees most of the day. By February things will start looking brighter.
 
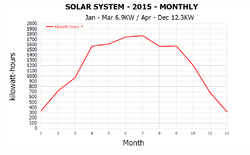
A chart showing solar PV kwh production for 2015. Interesting is that kwh in Jan and Feb, which was only the 6.9kw system, were nearly the same as Nov and Dec, which now included the additional 5.3kw. Lots of very cloudy weather in Nov and Dec.

Also interesting in that April - Oct had monthly production in the range of 66% or better of July which was the highest production month. It is clear that on a broad geographic scale utilities/grid can depend on a high level of consistent and predictable solar PV kwh availability to meet high AC and other summer demands for power.
upload_2016-1-3_5-46-12.png
 
Last edited by a moderator:
Screaming PV on February 12, 2016. Clear sky, temperature +1F, on a 5 minute log, output nudged over 12,000 watts for three 5 minute intervals from 12:35pm to 12:45pm (12,040 - 12,130 - 12,040 watts). Since the system was expanded to 12.3kW on April 9, 2015, this is the first recorded production over 12,000 watts. With many more clear, cold days yet to come (hopefully, or not!), it will be interesting to see how high production will go. The initial system at 6.9kW actually briefly reaching output into the 6800 watt range. The microinverters carry a nominal rating of 6500 watts total, so they were exceeding their rated output on these occasions. I noticed clipping only once with the 6.9kW system.
 
Awesome. Are you getting gain from snow reflection too?

We are finally starting to see some decent output, but too brief. Our location and the low angle of the sun still make for a lot of shading issues in February.
 
Gain from snow reflection for sure. Hard to measure exactly what that is. Finished theday at 70.1 kWh.
upload_2016-2-12_17-36-3.png
 
Last edited by a moderator:
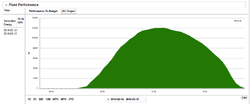
February 29, leap year day, and PV mounted a stunning performance on a cold, cloudless day: 82.73 kWh. Peak output at 12,131 watts, and that's average panel output of 264 watts. Based on the flat top of the curve, I would say the microinverters maxed out and were clipping panel output. 26 of the panels are rated at 265 watts and 20 at 270 watts. The Aurora microinverters are rated at 250 watts nominal output, maximum output of 260 watts, and maximum usable power of 265 watts. Annual output is on schedule at 16MWh, with the first full year of the expanded system ending on April 9.

The all-time high daily output remains at 89 kWh which occurred on April 22, 2015. Maybe a surprise will be in store for this year with some more cold, clear days.

upload_2016-2-29_18-39-13.png
 
A little more detail.
upload_2016-2-29_19-3-18.png
 
April 1-4 has delivered awe inspiring sunny days and production for the four days totaled 315kWh, the high day being 86kWh. That four day total exceeded total December 2015 production of 310kWh, and is about 1/2 of the production of both November 2015 and January 2016, each at 673kWh.
 
The first equipment failure occurred a few days ago: one micro-inverter failed (under warranty). The mfr is supplying a replacement. I only can guess at the reason, and that is that cloud cover was quite heavy, then a brief clearing of the clouds and a burst of sunlight, power output spiked high on the panel served by the micro, and the micro failed. The micro has been in service 2-1/2 years. This type of sunburst is not unusual, it has happened many times before, and I hope that future such failures do not occur.
 
What brand and model of microinverter?
 
One would think that transient spike protection would be built in to the design. Could just be a component failure. How much work will it be to replace this micro-inverter?
 
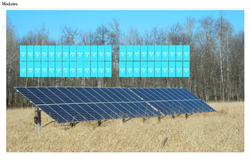
Since he has a rack mount in the photo, its probably pretty easy compared to a roof mount.

Microinverters have it tough, the ambient conditions are brutal and in order to be competitive they have to be inexpensive. Generally the solution is build them good enough to get the cash flowing and then deal with the warranty issues later. Enphase has replaced a boat load of the early 190 watt units but so far has survived to come out with hopefully better product.
 
I didn't go for Enphase on our arrays due to the limited lifetime of electrolytic capacitors. Have they changed this in their newer units?
 
Not sure, the newer ones just don't seem to be failing as quickly although I have seen reports of occasional failures.
 
The microinverter is the ABB MICRO-0.25-I-OUTD, nominally rated at 250 watts. The last report from the micro before failure showed output at 222 watts. But a sunburst does produce a burst in panel output that can spike quite high before falling back to a full sun output scenario. The micros I have easily have output up to 265 watts before clipping is evident.

With the ground mount, and the micro that failed being on the bottom row of the array, replacement will be very easy. Maintenance and service, if needed, is a real plus with ground mount. I expect a replacement to arrive soon.

I haven't seen reports of other failures with the ABB micros, but I do not spend much time trying to track failures. ABB is a big company in the electric power industry.
 
Thanks, folks always ask me about micros. I have a lot more faith in ABB than Enphase.

Folks tend to get scared away from ground mounts or pole mounts. Yes they cost more up front but the option for installing at optimal seasonal angle or in the case of pole mounts having seasonal angle adjustment is big plus. I expect the environment for microinverters on the back of a ground mount is far less harsh than sitting between a shingle roof and a panel. Its a lot easier to clean off snow and I find the winter time extra irradiation from snow reflection boosts output compared to a roof mount.
 
We have one ground and one pole mounted array. Both feed into a PowerOne 2 channel inverter. The pole mount is angled to the SW. This helps lengthen the output time over the day. So far no issues except that one needs to be careful weedeating near a ground array. An errant pebble thrown by the weedeater can shatter the tempered glass. (don't ask how I know)
 
I've looked at the temperature graphs from my enphase M215 microinverters before. I just looked at the graphs of the past week from several of them just for curiosity. An inverter near the peak of the roof seems to hit 127°F in the middle of the output day. Inverters near the eave of the roof run 114°F on a similar day. Although technically hot, it's not the harsh environment hot I tend to expect of gear I specify to run mounted in a closed metal electronics cabinet in the blazing sun. I find it curious the peak temperature does not necessarily coincide with peak power output from my system. That may be due to my roof facet facing ~16° West of South.
 
I received the warranty replacement micro and my PV installer electrician switched out the defective micro for the new one. Reprogramming the data collection devices, which I did, also was easy. What was a little tricky is that the micros store cumulative data and also transmit data to the ABB web portal, and some ABB tech guidance was needed to make sure that stored data related to the replaced micro was not lost. A quick phone call to ABB was very helpful on this.

The ABB MICRO-0.25-I-OUTD (250 watt) are no longer being made, higher output micros now are the norm. I did find a PV supplier who still had the 250 watt micros and I bought two for $100 each to keep on hand for backup replacement. Switching one out is not difficult.
 
Out of curiosity does the microinverter use the locking MC4 connectors that require the special tool?

Smart idea stocking up on couple spares. I have spare PV panel stashed away for my orphan Evergreens. Wish I had bought one for my other arrays but they are safe up on roof while the Evergreens are on a pole mount and far more accessible.
 
Out of curiosity does the microinverter use the locking MC4 connectors that require the special tool?
Yes, but the special tool is a very simple device, easily bypassed with an even more simple homemade tool.
 
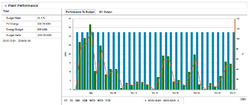
May 2016 turned out to be a very good solar month, coming within a few kWh of my estimate of the system's average performance potential: total energy for the month was 1.81 kWh vs 1.82 kWh of potential estimated performance, just 18.73kWh short of meeting the estimate. One more sunny day during the month would have pushed production over the estimate. The blue bar is the estimated daily average performance for May (58.87kWh) and the green bar is actual performance. Maximum daily performance hovers right around 83-84kWh, about 6.75kWh per DC kW rating of the system (12.3kW).

There seems to always be something that results in less production than might be expected. In May (besides weather) it was smoke from forest fires in Alberta. Those fires may burn for a long time with a negative impact on irradiance in northern Minnesota. Other more "normal" negative factors can include increased clouds and rain events, higher than normal air temperatures, higher than normal humidity, and higher than normal dust blowing in from the Dakota's and western Minnesota.

Regardless, as of June 8, 2016, our utility bill already has an outstanding credit of nearly 3,700 kWh and during 2016 our electric bill should be fully off-set by solar PV credits. Most of the credits are consumed by kWh for supplemental electric heat during the winter.

upload_2016-6-18_5-55-54.png
 
With Christmas nearly here, the PV system reminds me of the generous gift of the sun. Total energy to date: 38,222 kWh with a value of $5,708. Being just about at the shortest day of the year, and the sun rising only 19* above the horizon and nearly clear days, daily energy is still in the 30-34 kWh range.

upload_2016-12-20_5-45-33.png
 
  • Like
Reactions: Where2