data logger

  • Active since 1995, Hearth.com is THE place on the internet for free information and advice about wood stoves, pellet stoves and other energy saving equipment.

    We strive to provide opinions, articles, discussions and history related to Hearth Products and in a more general sense, energy issues.

    We promote the EFFICIENT, RESPONSIBLE, CLEAN and SAFE use of all fuels, whether renewable or fossil.
Status
Not open for further replies.
mwk1000 said:
https://www.hearth.com/econtent/index.php/wiki/File:ttymon_v1.tgz/

I have managed to post the tty monitoring utilities - only gzip tar files seem to work. Not txt not plain tar. Arduino sketch is in the tar file as well. That will make something you can download and save for later if you ever want to play with the arduino board and Dallas one wire sensors.

I'm going to put a link to your file on the wiki page I started under Category:Controls -> Arduio Controller if you don't mind.
 
sgschwend said:
If you are asking if there is a multi channel temperature data logger. You may like this product. Eight temperatures, 3 relays, LAN (connect it to your local network), uses a web browser to setup and review the data from your easy chair, office, or anywhere you have web/network access. The cost including 8 probes would be about $300.

http://www.controlbyweb.com/x300/software.html

i read through the manual on this last night and i have reconsidered. it appears that unitt will do everything i need except grab and graph the data on the pc. have people done that with an excel macro, or do i need to buy some kind of software (i see the site offers a link to a web based software option where you pay annually for it to log the data, but i would rather have the data in excel to play with)?
 
i read through the manual on this last night and i have reconsidered. it appears that unitt will do everything i need except grab and graph the data on the pc. have people done that with an excel macro, or do i need to buy some kind of software (i see the site offers a link to a web based software option where you pay annually for it to log the data, but i would rather have the data in excel to play with)?

This little gadget supports SNMP, meaning that there are a stunning number of graphing programs available. Type "snmp graphing" in Google and stand back. I use one called MRTG quite a bit for network data but it's really all the same.

The temperature sensors are clearly readable as OID's in the MIB. ( That means Objects that can be polled in the Management Information Base = Stuff to Graph ) Here is the SNMP definitions right from there site:

Code:
-- Entries for X300
tempOne OBJECT-TYPE
  SYNTAX  DisplayString
  ACCESS  read-only
  STATUS  mandatory
  DESCRIPTION
          "The temperature reading from sensor 1."
  ::= {X300 1}
  
tempTwo OBJECT-TYPE
  SYNTAX  DisplayString
  ACCESS  read-only
  STATUS  mandatory
  DESCRIPTION
          "The temperature reading from sensor 2."
  ::= {X300 2}
  
tempThree OBJECT-TYPE
  SYNTAX  DisplayString
  ACCESS  read-only
  STATUS  mandatory
  DESCRIPTION
          "The temperature reading from sensor 3."
  ::= {X300 3}
  
tempFour OBJECT-TYPE
  SYNTAX  DisplayString
  ACCESS  read-only
  STATUS  mandatory
  DESCRIPTION
          "The temperature reading from sensor 4."
  ::= {X300 4}
 
With the Arduino or otherwise, a PC is needed to log, display, chart, communicate data. Is there a PC board with ports to do the same? and programming to make it work? or a packaged system at a fair cost to do the same? Does the wheel have to be reinvented (except for the learning experience)?
 
jebatty said:
With the Arduino or otherwise, a PC is needed to log, display, chart, communicate data. Is there a PC board with ports to do the same? and programming to make it work? or a packaged system at a fair cost to do the same? Does the wheel have to be reinvented (except for the learning experience)?

It might be possible to have a central webserver for everyone to have their Arduino send their data to, via the ethernet shield. Then you could log in and view the data from your system without having to know any database or server side scripting (PHP). The one requirement would be that you would need an always on internet connection.

The biggest hurdle would be setting up authentication for the data coming from the Arduino since it doesn't support SSL.
 
For data logging of boiler operation, I don't think you need to worry about SSL. The worse case if someone hacks in is that data logged is invalid. The data coming in should be validated/filtered/processed before insertion to the DB so there is no possibility of SQL injection hacks. I like the idea of an Arduino web service, it would simplify logging for a lot of people, myself included. Remember, the cobbler's son has no shoes! I do secure software applications for a living but don't have a lot of free time to build my own logging environment.
 
jebatty said:
With the Arduino or otherwise, a PC is needed to log, display, chart, communicate data. Is there a PC board with ports to do the same? and programming to make it work? or a packaged system at a fair cost to do the same? Does the wheel have to be reinvented (except for the learning experience)?

nofossil's system has these features. I don't know all the specifics of his board, but I think it is basically a linux PC and has a web server and the datalogging without having to be attached to a separate computer. He has a lot of info about his controller on his web site.
 
The Control by Web data logger/thermostate/basic interpreter/emailer does not need to be connected to a computer. I think it would work best just connecting to the LAN. One way to do that is just to plug it into the router.

I have just received a XL300 and will try and make up the sensors today. I did play with it yesterday. The 89 page owner's manual is downloaded from the same link; it is loaded with application methods. I switched it from thermostat mode to data logger mode. Installed one sensor and set the log time to one minute. From my laptop I could call the device using my web browser. It does have security so you system will not be messed with (I noticed someone was concerned about that). The screen shot pages on the web page shows what you would find. The one I plan on using the most is the simple display showing the sensor values and relay states, (the sensors can be renamed by the user).

The data is battery protected, any data structure change will reset the database. The data is passed out in a text file, looks like the classic spread sheet formate of separated by semi-colons. It should be a snap to import and graph the data. I would expect you could have the spread sheet scrip import the data and setup the graphs.
 
The "WEL" data logger that I put up a link to a few posts back does offer that central database server logging service that people were wondering about - not sure what cost is for it (if any)

Gooserider
 
twitch said:
jebatty said:
With the Arduino or otherwise, a PC is needed to log, display, chart, communicate data. Is there a PC board with ports to do the same? and programming to make it work? or a packaged system at a fair cost to do the same? Does the wheel have to be reinvented (except for the learning experience)?

nofossil's system has these features. I don't know all the specifics of his board, but I think it is basically a linux PC and has a web server and the datalogging without having to be attached to a separate computer. He has a lot of info about his controller on his web site.

There are a few tradeoffs. Standard PCs have tons of computing horsepower and are pretty cheap, but very limited in their I/O capabilities. They also consume a lot of power and depend on cooling fans and other moving parts so long-term reliability is affected. They are pretty easy to program and have a nice built-in user interface.

For my system, I wanted very low power consumption - the NFCS is under 5 watts. I also wanted standalone operation (including datalogging) and very high reliability. The consequence is that I'm using more specialized and therefore more expensive boards. The system runs a stripped-down Debian Linux with Apache web server, telnet, ftp and a bunch of other useful goodies.

By default, I log all inputs, outputs, and internal states to an SD card every minute. The system stores a full year of logged data onboard. This is a good option since you don't lose data even if your network goes down. I also support logging to a remote SQL server - that's what I do to get my live graphs.

The challenge of using a small system like this is that the programming can be difficult and require fairly specialized skills. My approach was to develop a web-based interface for defining rules so that you don't have to deal with programming languages, cross-compilers, and downloading programs. It still takes some skull sweat, but you don't have to be a programmer. For those who haven't seen it, here are a couple of screen shots. A network connection is required to define or alter rules or to monitor the system, but it's not required for the system to operate. These screen shots show a few of the tabs.

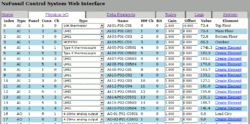
The Physical I/O tab allows you to select which inputs and outputs you're going to use. You can select the type of sensor that's plugged in to each input and provide individual sensor calibration data.

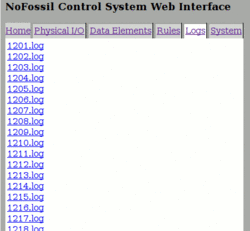
The Logs tab has clickable links for each day (in MMDD format). Clicking the link downloads that day's data into a spreadsheet on your PC.

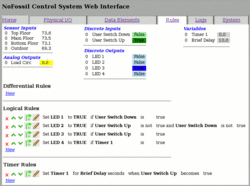
The Rules tabs lets you display, edit, and create rules. The rules here are a simple sample application that uses a switch and LEDs on the front panel. My hope is that the rule syntax is self-explanatory.
 

Attachments

  • physical.gif
    physical.gif
    47.7 KB · Views: 412
  • logs.gif
    logs.gif
    10.3 KB · Views: 419
  • rules.gif
    rules.gif
    27.3 KB · Views: 408
Here is the result from the first 24 hour or so of data logging with the 8 channel Control by Web data logger. The chart clock is off because I didn't set it correctly.

The chart shows the sensor measured temperatures of three storage tank locations, top, middle and bottom. The first part of the chart shows the heat moving from storage to the house and then the last 25% of the chart shows the heat entering from the boiler.

The chart was made with using Excel. Excel is capable of a directly importing the data logger's data; and also recording a scripts so that a macro can be saved. A one button chart solution would result.

I will setup the remaining sensors in a day or two.
 

Attachments

  • 24hr Storage Graph.jpg
    24hr Storage Graph.jpg
    23.1 KB · Views: 641
I’m going to put a link to your file on the wiki page I started under Category:Controls -> Arduio Controller if you don’t mind.

I finally got the controller wired up and operating on my tank. I added some samples and the updated programs in the wiki :

https://www.hearth.com/econtent/index.php/wiki/TankControl_Information/

So far so good, some Linux bugs stopped the show for a bit. I used RJ45 Jacks and wiring to get from the PC to th tank. I made a funny octopus cable with the sensors and the relay all ending in an RJ-45 plug. The same at the arduino with all the connections going into an RJ-45 Plug.

Just having the data is very enlightening. I can see that I though I understood how the tank was charging but I was off in understanding.
 
Data is power, congratulations!

I just replaced my second boiler sensor (one wire temp), don't know why but they both lasted one day. The other three sensors are still chugging away.
 
Yes, I really had no idea how much heat I was loosing in my line set. I assumed a couple of degrees over the 75' run but in actuality it is 10 or 11. That explains why I have never been able to get the tank over 177. The boiler usually chugs at 185 ish during the peak of the heating but that means that the HX is only getting 175 so it is no surprise to see that the tank will have a hard time. I will now turn some attention to redoing my lines with better insulation. I thought it was pretty good but the temps say different.
 
My data has shown that I use the about 1/2 of the storage heat in 12 hours time. The bottom half of the tank is down in the 125F range, which would still be good hot water but it does seem like a good temperature for recharge.

I have also found that there still is a lot of heat transferred after the fuel is gone. I have program my automatic shutdown set point temp. to a level that will take advantage of that.

Another interesting effect is the heat moves to storage in steps; where the entire tank reaches the new level before the top begins to see the next step. Such as 125F to 145F, 145F to 165F, 165F-175F.
(the top of tank receives the hot water first, then the middle and then finally the bottom)
 
Beautiful data, better than watching TV.

I see the same top, middle, bottom profiles.

Which one is the boiler? Panna?
 
Is this a flexible, low cost possibility for data logging and control: USB-1208LS?

It appears to be programmable with Borland C++, if I'm reading things right. When costing out the Arduino from scratch, plus parts, soldering iron, etc., the cost starts to rise. Is the learning curve on the software much different than learning C++?
 
It appears to be programmable with Borland C++, if I’m reading things right. When costing out the Arduino from scratch, plus parts, soldering iron, etc., the cost starts to rise. Is the learning curve on the software much different than learning C++?

Is Borland C++ much diffrent than C++ ? No - it is basically the same, The language implementation IS the same but the IDE's differ if you are asking about Microsoft Visual c++ vs borland. (Integrated Development Environments =IDE ). I looked at the page you showed and t looked much more like a Visual Basic .NET component based product. I did not see c++ in the supplied software. There is a softWire product that will allow graphical building blocks that you connect together. The next generation of programming these days that does not really require the knowledge of a Language. Most of what is provided requires .NET component base to work. Nothing wrong with that but it is not c/c++ more like c.# (C Sharp )

In any case it looks like a vehicle to gather sensor data and drive relays. I'm not sure I see as clean a path to making it happen as I did with the arduino and I see no linux so that would be a negative for me. Linux and all the needed software parts are free.
 
I absolutely agree - GNU/Linux and FOSS tools are a must for me for multiple reasons - one of the big ones is reliability - (Magic Question - would you fly in an airplane run by Microsoft software :gulp: ) OTOH, there are GNU/Linux distros that are specifically made for "High Reliability" applications - and even the standard distros are pretty good... I have NEVER had to reboot my system during normal uses, though I do occasionally need to restart some of my applications... The only time I have to power down is for hardware stuff, either upgrades or to blow the dust out of the CPU cooler and power supply every few months...

The other nice thing is the hardware support - Microsoft regularly abandons hardware (especially the "Win*" type products) and stops supporting it's drivers. Linux has the firm policy that they won't drop support for hardware with known users, once the driver has gotten into the kernel mainline. I've seen claims that there are drivers for devices which only have 3-5 known users, but are actively maintained... I know that if I get something running under Linux, it won't stop working just because the manufacturer decides to stop producing drivers, or otherwise makes the hardware "obsolete"...

Gooserider
 
Being an ex-aerospace engineer, I'm very sensitive to reliability and the possible consequences of failure. That's part of the reason that I chose the Technologics boards as tha basis of my system. Rock solid industrial-grade engineering and a bulletproof Linux implementation. No moving parts, zero hardware or software failures in all my time with them. In all fairness, I have had a couple of boards that were DOA, but if they work they seem to work forever. Hopefully I've designed software that's equally robust. I also spend a lot of time thinking about how to implement systems such that any likely failure does not result in loss of heat.
 
I've probably spent more time trying to find an "easy" monitor, log and control system than I would have spent, had I bought an Arduino and learned from scratch. That said, here is something that again looks quite interesting. Note the last three items on this page, especially the last one, which gives control over 4 relays. Here is another link to more info, with more links to more info. I don't like messing up the mix to much, but price and opportunity for the "average joe" to achieve quite a lot by taking this route looks reasonable.
 
Status
Not open for further replies.