data logger

  • Active since 1995, Hearth.com is THE place on the internet for free information and advice about wood stoves, pellet stoves and other energy saving equipment.

    We strive to provide opinions, articles, discussions and history related to Hearth Products and in a more general sense, energy issues.

    We promote the EFFICIENT, RESPONSIBLE, CLEAN and SAFE use of all fuels, whether renewable or fossil.
Status
Not open for further replies.
jebatty said:
I haven't seen DS18B20 sensors for less than about $4-5 each + s/h.

I got the 2 samples of the DS18B20+ here http://www.maxim-ic.com/quick_view2.cfm/qv_pk/2812/t/or to make sure they were going to work. Ended up just using the samples in my project, but plan to get more. A great opportunity for those trying out different temp sensor to get an idea of integration and accuracy. Still not a bad price if you have to actually buy them.
 
nofossil said:
For sure a full-blown PC is an easy way to get going, and with Linux / MySQL it's all free. My issue is that PCs suck a bunch of power. If the PC would be running anyway it doesn't matter, but I hate to add a power load like that if I don't have to.

For things that have to run 24/7, I like little embedded systems like the Arduino.

My personal experience with Linux based systems from full-blown servers to embedded systems is that it's really reliable but sometimes a challenge to figure out. Lots of people willing to help, and Google is a great resource as well. Good luck.

Bill,

Your system by far is the Cadillac of data logger / control systems. Well thought out and robust. Definitely top of the line. As far as cost goes though, I think it is hard to beat the arduino. I never really thought about the power consumption thing, but is you are "off-grid", the a down and dirty microcontroller like what is found on the arduino board may be the way to go.

As far as post processing the data once collected, I'm not sure how it can be done without a pc. I guess the old way.....pencil and paper :lol:
 
WoodNotOil said:
jebatty said:
I haven't seen DS18B20 sensors for less than about $4-5 each + s/h.

I got the 2 samples of the DS18B20+ here http://www.maxim-ic.com/quick_view2.cfm/qv_pk/2812/t/or to make sure they were going to work. Ended up just using the samples in my project, but plan to get more. A great opportunity for those trying out different temp sensor to get an idea of integration and accuracy. Still not a bad price if you have to actually buy them.

Found this place "googling" FOR ds18b20S, Tayda Electornics. At $1.60/ piece, that is the cheapest I found them, other than the free samples. They are located in thailand, so shipping is a week to 10 days or so. I think I may give them a try.
 
deerhntr said:
Bill,

Your system by far is the Cadillac of data logger / control systems. Well thought out and robust. Definitely top of the line. As far as cost goes though, I think it is hard to beat the arduino. I never really thought about the power consumption thing, but is you are "off-grid", the a down and dirty microcontroller like what is found on the arduino board may be the way to go.

As far as post processing the data once collected, I'm not sure how it can be done without a pc. I guess the old way.....pencil and paper :lol:

My system is a controller, and it's overkill for a lot of control applications. It's definitely way more than you'd need for just datalogging. It does have a fair amount of overlap with less expensive systems. Both it and the Arduino consume very little power, so there's not much cost associated with running them 24/7.

As far as analysis, that's what makes me interested in OpenFlashChart. A small embedded system like mine or the Arduino could log data onboard without processing, and spit selected data on demand to a full-blown PC with web browser which can then make the pretty charts.

Right now, I log data to an SD card and dump it on demand as a .csv file to a spreadsheet on the requesting PC. That allows in-depth analysis but doesn't make nice graphs without some additional effort.
 
Need to do some more work on the graphing proram, but here is a low resolution b/w graph of yesterday's 6 hour burn. I adjusted the bottom tank sensor part way into the burn, so the bottom graph line in the early part of the burn is not accurate, except for the start temperature. I only had 3 data channels monitored. Also a few pics of the laptop with the datalogger, just the datalogger, and my new and almost completed digital monitoring panel. Still a couple more digital thermometers to add.

I burned a total of 146 pounds of wood, kept the boiler in pretty much a high burn state. The available energy in seasoned (20% moisture content) wood used in an actual usage environment (400°F flue gases) is about 6050 Btu/pound. Wood Energy. My flue gases averaged around 480F, so my actual available Btu/lb is less, but using the 6050 figures, total wood energy delivered during the burn was 883,300; storage raised approximately from average of 150 to 190F (+40F) at 1000 gal = 333,600 btu's stored; during the burn outside temp was +5F and windy, inside temp started at 50F and ended at 68F. Btu's delivered to storage was approximately 38% of total energy delivered, balance to heat the shop.
 

Attachments

  • Output2.jpg
    Output2.jpg
    52.3 KB · Views: 417
  • DSCN1624.jpg
    DSCN1624.jpg
    109.2 KB · Views: 409
  • DSCN1625.jpg
    DSCN1625.jpg
    114.8 KB · Views: 401
  • DSCN1629.jpg
    DSCN1629.jpg
    53.6 KB · Views: 443
Is their a onw-wire temp sensor that will work in the flue gas? Any suggestions where to get one?
 
Hunderliggur said:
Is their a onw-wire temp sensor that will work in the flue gas? Any suggestions where to get one?

Unfortunately, the max temp on the DS18B20 is 257 °F /125 °C. I'm afraid flue gas temps cross over into the realm of thermocouples.
 
All but the bottom right were from Sure Electronics and about $18 each, 2 channel driven with DS18B20 sensors (two provided), or with other sensors (NTC). I've had trouble so far to get them to work with both channels, ch 1 is working fine, but am getting advice from Sure to solve the problem. When and if the two channels work, you can display ch1, or ch 2, or alternate between ch 1 and ch 2 automatically, display in C or F. The bottom right uses K-type for the flue, single channel, about $20 from Procon. All meters operate on 12vdc.

Sure Electronics
Procon
 
How many one-wire sensors can a single Arduino controllerhandle? I know I could RTFM, but it is probably quicker to ask here. At $2/sensor and $40 for the controller, my wish list is adding up fast - Storage top/middle/bottom times 2 (6), 4 zones, outside temp, boiler out, boiler in, HX in, HZ out, ref/freezers (why not - it can alarm me) = 18+.
 
Hunderliggur said:
How many one-wire sensors can a single Arduino controllerhandle? I know I could RTFM, but it is probably quicker to ask here. At $2/sensor and $40 for the controller, my wish list is adding up fast - Storage top/middle/bottom times 2 (6), 4 zones, outside temp, boiler out, boiler in, HX in, HZ out, ref/freezers (why not - it can alarm me) = 18+.

One wire sensors are designed to operate as a network. Each sensor has a unique 64 bit address which allows the sensors the then share a bus of three wires(Ground(GND), Vdd(Power 3V-5V), and the Data line(DQ). It is the job of the controller(arduino) to address each sensor individually to read or write. So, in theory a one wire network can have as many sensors as you want, all on just ONE 3-wire bus. I have read of networks of over 2K(2000) sensors, and 500 meters in length. 18 sensors is a chip shot.
 
Great! I can't wait to get my allowance ;-P Maybe I will order a BUNCH from that overseas supplier. Let's see chicken brooder, well temp, ......
 
Where you might run into a tight spot isn't on the number of sensors, but on the processing hardware end... I haven't studied it in detail, but I would imagine that each sensor would require a certain minimum amount of processing and storage space just to read the data off the sensor and stuff it into memory - I suspect that this might be reasonably substantial, and cause a resource shortage at some point, especially on a comparatively low horsepower unit like an Arduino... Of course that wouldn't rule out having multiple nets, each with its own raw data collector Arduino, feeding into a central server...

Gooserider
 
Gooserider said:
Where you might run into a tight spot isn't on the number of sensors, but on the processing hardware end... I haven't studied it in detail, but I would imagine that each sensor would require a certain minimum amount of processing and storage space just to read the data off the sensor and stuff it into memory - I suspect that this might be reasonably substantial, and cause a resource shortage at some point, especially on a comparatively low horsepower unit like an Arduino... Of course that wouldn't rule out having multiple nets, each with its own raw data collector Arduino, feeding into a central server...

Gooserider

The Arduino USB board has 32K of program space(2K used by boot loader). If program memory space is a concern, the Arduino Mega has 128K(4K used by boot loader) of program space, but it costs $30 more. My program for 5 sensors is 8K, and a program for 1 sensor is 7.7K. So there is about 7.6K of overhead, and that's roughly 100 bytes/sensor. Not a large amount of memory space / sensor. As far as processing power goes, the arduino is really just reading and writing a digital pin to poll the one-wire sensor network, then a small amount of math to convert °C to °F, then serial back to the PC. Temperatures changes really slow in most HVAC systems, so even if your loop slows down to poll ever 30 seconds to a minute, who cares. Right now, I slowed things down to poll every 10 seconds, and it still to much data. once a minute is most likely fine.

A couple of draw backs I see with a general purpose microcontroller board like the arduino are:

1) They are designed for hobby/bread boarders. So they do not have a case, strain relief for wiring, minimal or no circuit prototyping area. The arduino does not even come with stand-off legs so that you can place it safely on a table top. You will need to "package" your project once you finalize the design.
2)You need to be willing to hack some code, solder some wires and components, and debug your project to get it up and running. You most likely won't need an oscilloscope to figure out the read/write timing, but you may need a DVM, and some resistors and capacitors to tune your network if it gets big. A little "web research" will be require also. The Dallas web site has some really good info/app notes. Dallas One Wire
3)Using one for a system Controller(ala NoFossil Controller) would be a stretch. Lots of things to worry about, so just buy one of NoFo's systems and save the time , worry and effort.
4)As goose pointed out, at some point memory space and processing power will come in to play, but for my application of a data logger with maybe 20 or 30 sensors in the end game, it should work fine. Others will have to make their own call.

Enjoy
 
Had to show my improved data logging and graphing skill. Here is a 24 hour period in 20 minutes samples. The graph shows in fact what I believed to be true about good stratification in a 1000 gallon horizontal tank. The sharp rises in the top of tank line clearly shows when I added wood after the initial loading.

The very simple 4-ch data logger I've described above works well and is a very inexpensive entry into data logging, for anyone interested. Graphing programs are readily available and inexpensive also. The wrinkle is processing the text data from the data logger. The spreadsheet program I have (not *xcel) is not good at this, and maybe another spreadsheet program would be. I described above use of a database program, and unless someone has another way, I would recommend the database route: MySQL or similar, for example. Mine is an old DOS-based program from the 1980's which works exceptionally well at near lightning speed. The database program inputted and processed 276,328 lines of temperature data to output 72 lines of data for the graph in about 8 seconds (one output data line for each 20 minute sample in the 24 hr data period).

Another way to go is to get a more advanced data logger (available at <$100) with some programming which would allow a programmed data sample rate and possibly ready-formatted data output. This would greatly simplify data collection and likely be well-adapted to using a spreadsheet program for any final data processing and graphing.

I suspect that if you already have a Linux or Windows database program, MySQL or similar, for example, you not only could process the data but also could design and output a graph without needing a separate graphing program. You probably also could do a real time data input directly from the data logger and output a real time graph. From there the real time website is only a skip away.
 

Attachments

  • DATAOUT3.jpg
    DATAOUT3.jpg
    32.7 KB · Views: 423
So after 16 hours you haven't even started pulling the heat from the middle yet! 1000 gallons, said like Homer Simpson.

Your tank did send me a message asking for a thicker coat, all kidding aside, do you think more insulation would help?
 
sgschwend said:
So after 16 hours you haven't even started pulling the heat from the middle yet! 1000 gallons, said like Homer Simpson.

Your tank did send me a message asking for a thicker coat, all kidding aside, do you think more insulation would help?

Not the way I interpreted it, Steve... It looks to me like Jim is getting a bit of mixing up at the top, perhaps excessively so... I see the entire tank going up to a peak, followed by a rapid drop of the bottom to about a 20-25°F differential, and then the entire tank dropping at the same rate... (as all three sensors have a parallel path) That suggests to me that there is some mixing going on, which is hurting the stratification.

The ideal would show a rapid drop in the bottom temp, down to lowest useable temp, while the middle and top stayed at or near peak. Then the middle would follow the same pattern while the top stayed level, until the cold reached the height of that sensor, and you got a drop at the top - which would be the signal to re-fire...

Gooserider
 
So, because the bottom did not drop that far compared to the other probes you think it is mixing? If the bottom had dropped quite a bit more then you would say the tank needs more insulation?

I think that my 500 gallon tank: the top drops about 10 degrees in that amount of time while the bottom drops 40-50.
 
sgschwend said:
So, because the bottom did not drop that far compared to the other probes you think it is mixing? If the bottom had dropped quite a bit more then you would say the tank needs more insulation?

I think that my 500 gallon tank: the top drops about 10 degrees in that amount of time while the bottom drops 40-50.

Well, lets split that in half...

1. NoFo, and some of our other people have said that a well insulated tank will drop 1-2°F / day w/ no thermal draw on it. This doesn't seem unreasonable to me as a goal, as per the descriptions I've seen it doesn't take huge amounts of insulation to get to that point, but going for more than that gets expensive in terms of the amount of thermal efficiency gained... Even assuming that the cost per inch of added insulation is a constant, if each additional inch cuts the thermal loss by 50%, the first few inches cut a lot of loss, but at the 1-2°F / day level, the gains are pretty small...

OTOH, if the tank was not well insulated, then you'd see a drop across the entire tank, though the hot sections would cool faster than the bottom since radiation is a function of ΔT. Still should be a fairly steady drop...

It is possible that lack of insulation is part of the explanation for Jim's temp drop - I seem to recall him saying he leaves part of his tank bare so that it can act as a shop radiator...

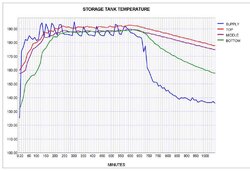
2. If one had the hypothetical "perfect" tank with complete stratification, then the tank temperature would be low (minimum usable temp or close to it) at the bottom, and at some point you would have a narrow thermocline separating the hot and cold layers, with hot on top, with very little change in temp within the hot and cold layers. As the heat was used, the thermocline would slowly move up the tank till it reached the top... If you had a series of sensors (say 10, instead of just three) you would see a "stair step" effect as each sensor would be reading at the hot temp until the thermocline reached the sensor, at which point it would drop steeply to the lower temp. W/ only three sensors, I'd expect to see the same thing, just not as dramatically. The narrower the thermocline, the more abruptly the temperature would drop.

OTOH, if there is a lot of mixing, I'd expect to see less difference between the sensors.

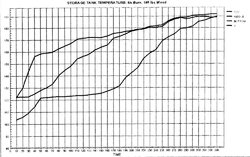
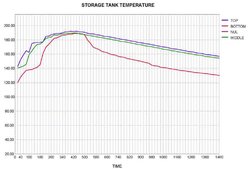
Looking at Jim's chart, I see a high peak with all three sensors within a degree or so of each other at around 420-450. All three sensors start to drop at the same rate till around 500. Shortly after that the top and bottom sensors continue to drop in unison, while the bottom sensor drops till it has about a 20°F ΔT by around 660, with most of the drop happening from 500-580. After that point, all three sensors drop at the same rate until we hit the end of the chart.

I see two possible explanations - either there is enough mixing in the upper portions of the tank to drop both sensors at the same rate, or we have good stratification, w/o pulling enough heat out of the tank to make the middle sensor see the thermocline and start dropping, but the entire tank is going down because it isn't insulated well... (If we had more sensors in between the 3 that are already there it might be easier to tell which it is...)

Gooserider
 
I think there is enough room here for everyone to have some truth. I can add a little bit for objective evaluation.

1) Tank is 19' long, 39" (maybe 36") diameter, and about 8' is not insulated: 1-1/2' at each end and 5' left of middle. After the 5' uninsulated portion and moving towards the near end there is 2' of 6" fiberglass. All three sensors are in the middle of and under that piece of insulation and taped to the tank exterior with aluminum tape. The balance of the insulation around the tank also is 6" fiberglass.

2) In that 5' un-inuslated section is all of the plumbing: the supply pipe with a right angle fitting inside the tank to direct hot water to the far end of the tank, and about 8" away towards the near end is a dip tube to the bottom of the tank for the return.

3) Supply is controlled by a two-stage controller. The first stage supplies about 4-5 gpm while boiler supply water is less than 188-185F. At 188F the second stage circulator is turned on and stays on until boiler supply temp drops below 185F. With both stage circulators on, supply is in the 8-10 gpm range. The two stage circulator control greatly minimizes boiler idling. Idling is an issue as my lines are 1", which at 10 gpm = 100,000 btu at Δ T20F, and my Tarm is rated at 140,000 btu. With my new shop and boiler move this summer, plumbing will increase to 1-1/4" which will handle full boiler output at 10 gpm or less.

4) I don't think much mixing occurs with stage one circulator. I am certain that mixing occurs when the stage 2 circulator is on. I need to put a sensor on the boiler supply for ch-4 on the data logger, and I think with a 4th curve for boiler supply the mixing may become visible. I will do that, perhaps tomorrow, and log again for a 24 hr period.

5) As to the parallel line cool down curve, the tank is constantly supplying heat to the shop. The temp drop was about 2F/hr. Outside temps during the curve period were in the -5 to +15F range.

Now, to be a little subjective, I am very pleased by the concrete information added through data logging and graphing. It takes so much educated guessing out of determining actual boiler performance. It really can be easy to do this, as the discussion above shows.

As a side note, I would strongly recommend to anyone who desires to optimize the performance of their gasification boiler to install at least two digital thermometers. The LED panel meter style is quite elegant and also inexpensive. One should be equipped with a probe style K-type thermocouple to monitor stack temp. I tend to think that stack temp may be the most important indicator of boiler performance. With my Tarm, a 465F stack temp is a purring boiler at 100-120,000 btu output. As stack temp rises above 500F, the Tarm easily is hitting the full 140,000 btu output, and at about 400F the Tarm is putting out a good 80,000 btu's. With this thermometer, all it takes is a glance to know exactly how the boiler is performing.

The second thermometer should monitor boiler return water temp. I now keep return water at 150F minimum and more usually very close to 160F. If return temp is below 150F, the Termovar balancing valve needs to be opened a little more to allow more boiler hot water feedback. If return temp gets much above 160F with system return under 160F, the balancing valve needs to be closed more to reduce boiler hot water feedback. No more guessing as to where to set this valve for proper return water protection. As I mentioned in prior posts, I have found that the boiler performs much better if return water is kept hot. I think owners are short-changing themselves if they operate their boilers with low return water temperature.

Of course, the really fun stuff starts with more digital thermometers, data logging, etc. None of this is very expensive or difficult to install. My monitoring panel is nearing completion, and again, just a glance and I now can can tell exactly what is going on at all critical points.

And thanks for the insights and help from so many during the 3 years of my gasification boiler experience.
 
One more chart, now with Supply also logged. From my perspective, the most interesting thing is how often my boiler is idling, in spite of my efforts to reduce idling. The upcoming move to 1-1/4" pipe and ability to move more water will address that. Unless someone is interested, I won't discuss what these reveals to me about idling.

Maximum Top of tank was about 194F, maximum Middle and Bottom were 190F. Bottom falls off quite rapidly, and Top/Middle stay together for the period logged with about a 3-4F spread. I'll have to log a longer period to see what happens with further cooling and impact on Top and Middle temp. All in all, quite revealing to me.
 

Attachments

  • DATAOUT-web.jpg
    DATAOUT-web.jpg
    40 KB · Views: 453
Great stuff,
It is interesting that you have a 10 degree cycle when you are reaching your peak temperature, that is the value I obtain too. Not the same boiler, I assembled the controller this Essex uses which is currently programed for 2 degrees of hysteresis.

I find that I try to fuel mine so that it might cycle a couple of times before the fuel is gone. The storage will be lower but that is OK, there will plenty of heat stored. That equates to about 3 cubic feet of wood.
 
I assume that your boiler return is pulled from the bottm of the tank. If so, your return water temp is much less than 20 delta T at about 180 until the boiler shuts off at 650. Of couse the boiler is cycling, you are not pulling BTUs out of the unit. It looks like the water is mixing and/or you had very little water at the bottom of the tank to heat. I would try letting the tank cool until the middle temp is closer to the bottom temp than the top temp, then try the test again.

Living vicariously through your graphs until I can get my setup. Right now I perform the hand test on the end of my tanks - gives you a very good appreciation of stratification.
 
I find that I try to fuel mine so that it might cycle a couple of times before the fuel is gone.

I do the same thing, but I didn't for this logging sample. I usually put in a final partial load of wood at about middle of tank temp 180F. That partial load then burns quite quickly and bring the entire tank close to 180-190F. My real world burns would involve little idling.

Hunderliggur - I think your analysis is pretty good. For a sample logging purpose, I am now going to let the tank cool substantially (we are starting a little stretch of more mild weather, 0-20F), and I am logging the cool down, and I will log a full charge. Probably let bottom of tank drop to about 100F.
 
Status
Not open for further replies.