data logger

  • Active since 1995, Hearth.com is THE place on the internet for free information and advice about wood stoves, pellet stoves and other energy saving equipment.

    We strive to provide opinions, articles, discussions and history related to Hearth Products and in a more general sense, energy issues.

    We promote the EFFICIENT, RESPONSIBLE, CLEAN and SAFE use of all fuels, whether renewable or fossil.
Status
Not open for further replies.
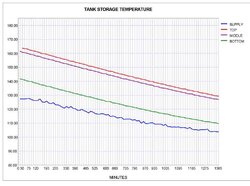
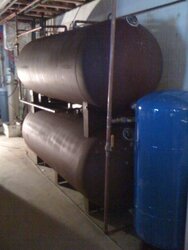
This is pretty interesting. I have an open tank with an undersized HX coil in it, so I end up not getting much stratification.

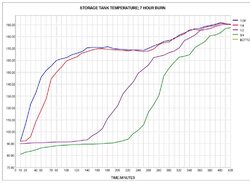
I've included a chart. but it's more interesting to click this link to get a 'live' flash chart - I finally got it working to my satisfaction.

I'd love to get the stratification values that I see in your charts. I do find it interesting that the tank bottom temp gets so low so quickly.
 

Attachments

  • Untitled.gif
    Untitled.gif
    35.2 KB · Views: 396
The flash link does not load for me. Will give more thought to the differences in our tank stratification.
 
Nofo - I am confused - How do you take 130+ Wood Out and heat a storage tank at 160-170? Is the graph above and the current at Orlan Boiler starting at 4:00AM on Wednesday February 3 AFTER the boiler has shut down and we are just seeing the cooling of the boiler connections? It looks like the boiler is not runnin based on the flue and combustion temps being the same.
 
Hunderliggur said:
Nofo - I am confused - How do you take 130+ Wood Out and heat a storage tank at 160-170? Is the graph above and the current at Orlan Boiler starting at 4:00AM on Wednesday February 3 AFTER the boiler has shut down and we are just seeing the cooling of the boiler connections? It looks like the boiler is not runnin based on the flue and combustion temps being the same.

Yes - this is the tail end of the fire dying out. The system actually switches to tankmode at around 4:40, and the tank circulator kicks on at about 5:30. If you click on the link that I provided and then choose the 'Previous' button, you'll see the fire and tank heating as below:
 

Attachments

  • Untitled.gif
    Untitled.gif
    66.5 KB · Views: 327
That is more of what I expected. You can see how the stratification eventually reaches the peak boiler output temp. From the graph above it looks like less than half the tank got to the upper temp since the middle temp is the same as he bottom temp. Of course, it could be 1 inch above the middle but we would never know unless there were a lot more sensor. Very interesting data that allows for a lot of evaluation and decisions on fuel management. I can't wait to get my system instrumented.
 
I let the tank cool another day, and here is the result. Keep in mind this is passive storage, meaning I'm not actively drawing down but draw down occurs through radiation and convection to the surrounding space. This probably is "best case" use of storage in the sense that there is no flow or mixing at all during the draw down period. It fully appears that a high degree of stratification is preserved through the "draw down." I didn't want to let it go much further by letting it sit until tomorrow morning, as my shop was down to 50F and a low of 7F is predicted for tonight.
 

Attachments

  • DATAOUT-web.jpg
    DATAOUT-web.jpg
    39.9 KB · Views: 318
My 2x500 tanks do the same thing - radiate to the basement whic keeps the 2500 sf first floor much warmer. I'll do the math on the next draw down to make an estimate of the number of BTUs transferred.
 
NoFo - let me test some comments about your chart that starts with the tail end of the burn. You have a coil heat exchanger.

1) Your maximum top of tank temperature is about 175-180F, which is about 10F less than I achieve with pressurized storage. It seems that about a 10F approach temperature is pretty much the design norm for a heat exchanger, be it coil or plate. It is difficult and expensive to do better than that.

2) I don't understand why your bottom/middle temperatures don't go any higher. Are you drawing so many btu's that you cannot get all of storage to any higher temp?

3) When the tank is in charging mode, is hot supply water injected into the top of the coil and cooler return water to the boiler drawn from the bottom? This flow pattern would seem to achieve maximum btu transfer to storage.

4) Conversely, when you are drawing from the tank, is hot supply to your zones being drawn from the top of the coil and cool system return water returning to the bottom of the coil? This flow pattern also would seem to achieve maximum btu transfer to your zones.

5) Rapid drop in top of tank seems to me to be the expected result.

6) Top/middle tracking closely and about a 10F temp drop to bottom of tank is not too much different than my chart, where top/bottom track closely (4-5F spread) and then a 20F temp drop to bottom. I'm wondering if a reason why you don't experience a greater temp drop to bottom relates to the temp of your system return water? If your system return is coming back at about 150F, then bottom of tank will not be cooler than that. My bottom of tank is partially exposed to quite cool air along the floor of my shop, which may explain why I have a greater temperature drop.

One thing for sure, with data charts it is much easier to see and understand how a system actually works. Most people just want to stay warm. A boiler geek needs something more.
 
Thanks for the comment on the btu radiation. Missed that. Nearly 12000 btuh -- from the biggest radiation in the county!
 

Attachments

  • Tank-web.jpg
    Tank-web.jpg
    19.5 KB · Views: 317
I'm heating the house with only excess heat going to storage. I didn't have enough heat output to raise all of storage to a very high temp. I'm burning a lot of real garbage wood this year - mostly punky poplar, white pine, and sawmill scraps.

I do charge storage with top-to-bottom flow, and discharge with bottom-to-top.

I don't have much baseboard, so my return temps are pretty high.

A cool thing about having data is that you can look back over time to see what's changed. Here's the same day, three years ago. I didn't have flue and combustion temp sensors back then, and the tank bottom sensor was having an intermittent problem.

One big difference: back in 2007, I didn't do a very good job of preventing the boiler from idling. You can see big fluctuations in outlet temp.
 

Attachments

  • Untitled.gif
    Untitled.gif
    56.4 KB · Views: 447
Jim, My radiator is bigger than your radiator! Not insulating until I save my pennies for the HX and circulator. Working well to heat the basement below 2500 SF of heated area. Really keeps the fossil fuel heat from switching on.
 

Attachments

  • tanks.jpg
    tanks.jpg
    56.6 KB · Views: 442
Better than good. The bigger the radiator the better. I watched Hunt for Red October last night. Now, one of those behemoths would make a good radiator.
 
I feel I might be providing more than anyone wants to see. I did the "permanent" installation of sensors on my storage tank, but went with 4 of them top get more comprehensive readings: top, 1/4, 1/2 3/4 and bottom. I also fixed them solidly to the exterior of the tank with aluminum tape, and secured well the 6" of fiberglass insulation covering them to minimize any air leaks. By happenstance I was gone for a couple of days, so the tank cooled down well. Here is the loading chart. The passive discharge chart will follow after a couple of days. In doing this, I found that one of my sensors on the prior charts had an air gap between it and the tank (middle sensor) which likely resulted in the parallel temp differential from the top sensor. That has now disappeared on the load side, and I believe it also will disappear on the discharge side.

I installed the data logger in a small project box and put a "euro" style terminal strip on the side for the sensor connections. This will permit using the datalogger for different sensors in the future.

If I'm overdoing this, somebody say something. I guess I'm having so much fun that I want to share it.
 

Attachments

  • DATAOUT-web.jpg
    DATAOUT-web.jpg
    35 KB · Views: 440
  • Control web.jpg
    Control web.jpg
    37.3 KB · Views: 416
nofossil said:
jebatty said:
If I'm overdoing this, somebody say something. I guess I'm having so much fun that I want to share it.

I'm pretty sure I can't accuse anyone of overdoing this sort of thing.......

I've always liked the expression that "anything worth doing is worth overdoing"-- and sometimes it's fun (and less expensive) to watch and get the vicarious fun of _someone else's_ overdoing of things.
 
As we say on the left coast, Van Nuys.

OK for a little kibitz? What are you using for your hot water input line/defuser? The 1/4 almost looks like the top, perhaps it has to do with the volume, I don't suppose you determine location based on volume?

I was thinking about updating mine to reduce the mixing. Since it is already installed I was going to directly port the top with fittings that would give about 300% increase in area. Would not need to weld, just drill and tap.
 
Jim,
I think being able to measure your storage by quarters is a good minimum increment. Besides the "Joy of Data" aspect of it all, knowing better where your thermocline is will allow you to get to the point where you could load the boiler with just enough wood to fill the storage and supply the current load during the burn without overloading the firebox and having the thing idle away heating the great outdoors.

Mae West and I differ on this particular point. Too much of a good thing might not necessarily be wonderful.
 
What are you using for your hot water input line/defuser? The 1/4 almost looks like the top, perhaps it has to do with the volume, I don’t suppose you determine location based on volume?

I see I mislabeled the chart. It should be "TOP, 1/3, 2/3, BOTTOM." I only have 4 sensors. Clearly the top 1/3 (about 12" of vertical height) is mixing quickly, but it is only 12" of vertical height. Based on the wide time gap between the top 1/3 and the next 1/3, I would surmise that some mixing is occurring in the top part of that segment as well. Still, at the end of one hour there is 155-130F water in the top 1/3 of the tank -- very usable for most heating purposes.

Initial system flow rates would be about 2.5 -3 gpm based on a 90F +/- temp rise, and end flow rates for my system max out at 9-10 gpm. Flow rates differ because of action of the Termovar iin recirculating to the boiler and my 2-stage circulator boost at high boiler supply temp.

The input is a 1" line about 1/3 of the way from an end of the tank and with a 90* bend in the direction of the other end of the tank to "shoot" water horizontally along the top of the tank. Return is from a diptube an inch or so off the bottom of the tank.

I also noticed that the Tarm performs near rated capacity. Average tank temperature at the start of the 7 hour burn was 87F and at the end of the 7 hour burn was 188F. That means that average btuh input into the tank was 120,334. Based on the prior charts showing tank draw down to heat the shop at the rate of about 13,000 btuh, the Tarm was delivering about 133,000 btuh, almost rated capacity of 140,000 btuh. I still need a means to log flue temperature, which I am working on. I kept the burn going pretty much on the "full" side, and flue temps mostly were around 480-490F.

The data logger and my digital thermometers both use DS18B20 sensors, and where I have log and temp sensors located together, I'm getting the same readings +/- one degree.
 
I am considering the top 1/3 2/3 bottom. I have not done the math, but it is not simply top, 12", 24" bottom (on a 36 inch tank). Maybe one of our kids can figure this out for u ;-) I think it will be top, 15, 21 bottom (or somesting like that).
 
Good point! Much less water in top and bottom 1/3's than in the middle 1/3. This also better explains the curves on the chart. Thanks.
 
I must have had a brain *art when I placed the sensors on the tank. Old age might have set in. Anyway, the sensors are at TOP, down 9" (1/4 point), down 18" more (3/4 point) and BOTTOM. So, the middle 1/2 of the tank is the big gap between the top 2 and bottom 2 curves. Sorry.
 
Much less water in top and bottom 1/3’s than in the middle 1/3. This also better explains the curves on the chart.

Yeah, I was surprised when Autocad told me that in terms of horizontal layers, the middle 10" of my 37" dia. tanks held 1/3 of the volume. Sketch it out and it makes sense, but I hadn't expected it.
I bought an Ebay lot of bimetal thermometers and thermowells (5" dia. dials so I can read them across the room) so I'll be measuring the total 1000 gallons in sixths with top bottom and 5 evenly divided between them. With an additional thermowell next to each thermometer well because I know I'll want to go digital someday after reading all the stories you guys are posting. But I do love analog thermometers. At less than $10 each I had no choice.

Ebay serendipity seems to drive a lot of my designs.
 
Dave, I am interested in the metal meters you speak of. I looked at them on e-bay. Do they make a gauge that you can attach to the surface? These look like the meat thermometers I currently use. If they all have those 5" probe ends, it prevents it from making direct contact to the surface an an in-accurate reading. Forgive my ignorance on this.
 
Status
Not open for further replies.