Solar electric 6.5kw expanded to 12.3kw

  • Active since 1995, Hearth.com is THE place on the internet for free information and advice about wood stoves, pellet stoves and other energy saving equipment.

    We strive to provide opinions, articles, discussions and history related to Hearth Products and in a more general sense, energy issues.

    We promote the EFFICIENT, RESPONSIBLE, CLEAN and SAFE use of all fuels, whether renewable or fossil.
Me too. Bad days make less than 10kwh. Good days lately are over 60.

Averages still about 10% above PV watts calculations. How do you compare looking at averages month to month?
 
At the end of Sept I will post a new chart with the new PVWatts data to show how I match with the averages. One goal for the 1st year is 10,000 kwh, and I will not make that, absent an incredibly sunny end of Sept and Oct. 2nd goal is to erase my electric bill -- that goal will be met, I'm pretty sure. 3rd goal is to use no more kwh than my system produces in a year -- after lots of serious conservation, still a good ways to go on meeting this goal.
 
Since I started in late Aug.. I don't have that big 'bank' of kwhrs going into winter. Not sure if I'll make it with zero bill all winter. We shall see. System is oversized, so we'll see.

JP
 
September finished well, falling short of the predicted average by only 3kwh. This chart uses new PVWatts data, the net effect of which from the prior data is to move monthly kwh amounts around a bit and increase total annual estimated production up about 1 MW to just over 10 MW. The big deficit months were Nov, Dec and Jan, and totaled 991 kwh. For Feb-Sept the total additional deficit was 139 kwh. With just one month go to finish the first year, it is obvious I will not meet the predicted annual average.

Predictions are just that and nothing more. I am very satisfied with my system. A little wait and see, but credits plus production should now cover usage going forward, and I am not expecting any future electric bills. Energy price security, priceless.

upload_2014-10-1_7-20-10.png
 
I can't recall.. did you change PV watts calculations? I ran about 100kwh over predicted. About 7% above.

Happy so far. Remains to be seen if starting in late Aug.. if I can build up enough of a credit bank to make it thru winter without buying power. Worst PVwatts says 750 or so for jan.. with house using 1200 last year. We shall see.

Still haven't seen the first power bill yet... but they've read the meter. Kinda looking forward to it!

JP
 
did you change PV watts calculations?
Yes. My first estimates were based on 2% derate, which was do to my ignorance. With each PVWatts data update, plus with what I have learned, I think my derates now are pretty close to actual. Last Fall and early Winter were extremely cloudy. Hence the low production. October is starting out with dense clouds and mist. Production today was 3 kwh!
 
3!! and I thought I had it bad today at 9.142 :) My 'low water' mark is 8.975 Best so far was 74.031

It's fun to watch. I've got dailys on a spreadsheet which I have set up to watch monthly average. SMA website tracks it all, and will spit out .CSV file that cuts and pastes pretty easy into excel.

JP
 
I received the electric utility bill for the monthly period ending October 8: -$67.00 for the month and $728.00 total credits accumulated.

Nine more days to October 28 and the system will finish its first year of production. October so far is producing just about dead-on for the estimate of 757 kwh for the month, being at 455 kwh through October 19. I expect for the monthly period ending November 8 there still will be a net credit, but then due to supplemental electric heat I will be using credits for periods ending Dec, Jan and Feb 8, and I expect that accumulated credits will pay all of the bills due. If experience the second year is close to the first year, my bill for period ending March 8 will be slightly back into producing net credits.

It is very nice not to have to pay an electric bill each month.
 
  • Like
Reactions: JP11
Today, Oct 28, is the one year anniversary of my system. The 26 micro-inverters report total output of 8965 kwh. The production meter at the house reports total 8880 kwh. I'm assuming that the 0.9% difference is caused by line loss over the 280 feet of underground cable between the panels and the house and/or meter tolerance. Following the end of October I will have a more complete report and analysis of the first year of operation, with which I have been very satisfied.
 
Cool to see. I think I'm 'under' for oct. Been awful rainy.

Anxious to hit the one year point. I think that's a realistic time to figure out a true payoff.

JP
 
I was always of the understanding that annual output varies ±10% or more.
 
I was always of the understanding that annual output varies ±10% or more.
We'll see. I'm already 2.5 months into year #2. No complaints from me about my $43 electric bill last month, or even the $57 bill for September.
 
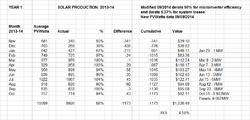
Hard to believe that one full year of PV is in the bank. The market was "down" a bit, with an ROI of 4.58% vs 5.18% had the Average PVWatts production been met. The "loss" occurred primarily in Nov, Dec and Jan, with production falling short by 991 kwh, and the balance of the year failing to meet average by 182 kwh. No complaint, however, because the same money invested in a CD would have produced only about a 1% return on a one year CD. But, one year does not an average make, so on to Year 2 and wait and see what the outcome will be.

As of Oct 8 credits on my electric bill were $728.00, and additional credits will be added with the billing and meter reading as of Nov 8. Based on last year's bills for Nov ($35), Dec ($59) and Jan ($54), and credits starting to accumulate beginning with Feb (-$41), I look forward to receiving a healthy check from my utility for the excess credits. One way to look at the check for excess credits is to consider it as dividends for an investment I have made in my utility to provide it with Net Zero power, and a dividend for an investment in the community to provide all of us with cleaner air to breath, fresher water and an improved environment from reduced acid rain, mercury and other pollutants, as well as a smaller hole in the ground from reduced usage of coal.

upload_2014-11-1_5-44-45.png

I also accumulated other data which is informative. I used 7120 kwh for utility interruptible service at a reduced rate (electric heat and domestic hot water, about 100 kwh/mo for dhw and average 500 kwh/mo for heat). I also used 3522 kwh of utility general service (about 300 kwh/mo), for a total of 10,642 kwh of utility grid usage. The utility also bought from me 6852 kwh, and I directly used 2070 kwh of PV production. My total electric usage was 12,712 kwh (1060 kwh/mo), which I believe to be above average because of above normal usage of electric heat due to the very cold winter last year.

During this first PV year we also converted nearly all of our lighting to LED. We also are very good at turning off lights when not needed and we have most electronics on power strips which we turn off when not being used. Except for the wood stove which meets most of our heating needs, our house is all electric, and substantial usage would relate to the electric clothes dryer, stove top, and oven. Any additional electric energy conservation at this time would be very difficult.

The final observation is -- very satisfied with the PV and look forward to future dividends for self and community.
 

Attachments

  • upload_2014-11-1_4-34-57.png
    upload_2014-11-1_4-34-57.png
    19.6 KB · Views: 220
Congrats Jim, I am glad you are pleased with your purchase. If I had a solar viable site, I would consider the same thing. To me the exciting thing is you made more power than you used. A great investment for you, your community, the global RE marketplace and an example for others to learn from and follow as to their ability.

That said, the ROI number leaves me a bit cold. CDs? The SP500 made 17% last year, so I figure you are currently down 10% as an opportunity cost, net taxes.
 
Well, you could make that argument. You also could make the argument that in 2002 the SP500 was down 37%. Or from 1969 - 1979 the CAGR of the SP500 was -2.66%, for example. How does that work for you? We've discussed this before, namely that solely as an investment a good argument can be made that an indexed SP500 fund will do better, by luck of the draw in the short term (could also be disastrous though), and quite likely in the long term, and "Over the very long run, the stock market has had an inflation-adjusted annualized return rate of between six and seven percent." http://www.moneychimp.com/features/market_cagr.htm

Unless we enter another very cloudy solar winter where the sun doesn't shine you know where, PV will kick out its steady, annual return, probably in the 4.5% to 5.4% range on the initial investment (assuming no change in electric rates). And if the 20 year average increase of 5%/year in electric rates is taken into account, the rate of return is much, much higher, and it is a near certainty that electric rates will rise. http://www.eia.gov/todayinenergy/detail.cfm?id=17791

My current rate is $0.115/kwh. If the rate rose 10% to $0.1265, my return on the initial investment just jumped from 4.58% to 5.55%, a 21% increase. Incidentally, my utility just announced a rate increase in its interruptible power rate.

In other words, PV is secure and rate inflation adjusted. And if and when a VOS tariff may apply to solar (MN is in the process of developing that), the rate of return will climb dramatically, probably double or more. And until then, my investment is making your life and our environment healthier, and for your thanks you are very welcome!
 
I think there are plenty of great reasons to invest in solar, and if you already have lots of exposure to index funds, I could see solar as a better choice than a lot of bond funds (not to mention CDs, ugh) to balance a portfolio. I'll agree that future electricity cost will roughly track inflation (based on the last 30 years of data). There are decent arguments to make both to the upside and the downside.

Looking over your spreadsheet at post #79 in this thread, I did not see any explicit accounting for the depreciation of the array (at least on the left), or things like inverter replacement (apologies if you discussed this elsewhere). That sheet seems to value the array proportional to its (projected) output. That is, you figure output drops 0.5% per year, and appear to depreciate its value at the same rate. If you figure your array has 0 value in 30 years, i.e. scrap, I think that knocks down your ROI considerably.

Ok, looking at the numbers of the right, I CAN interpret them as a complete writeoff of the original capital. If your net current value is +$12k in 30 years on a $22k investment, then you are seeing an (inflation corrected, i.e. current value) gain of 12/22 = 55% over 30 years. That works out to a 1.46% CAGR for that period, on a real basis ( 1.55^0.03333=1.0146 ).

So, as I see it you got something you wanted at effectively zero cost to you over a 30 year horizon. Nice. Lots of good intangibles. Are you 'making money'...not so much.
 
WG, I always (almost) respect and agree with your analysis. I am a moderate risk taker with some solid balance of security. So, at my nearing 70 years of age, I still have considerable stock market exposure, both in individual stocks and in ETF's, including the S&P500. And, because a long term market downturn could be a major upset in the retirement of my wife and me, I also maintain cash and equivalents to weather the downturn. When I was working full-time, self-employed, security came in the form of quickly paying off the mortgage and owning the home free and clear. Not the best place to put money in retrospect, but gave great peace of mind and freedom not to be bound to my employment, both great stress relievers. Essentially, my wife and I could live on her income if I would become disabled.

I look at the PV as another security enhancement with a positive financial, personal, social and environmental return, all things which mesh well with my values. In the final analysis, we used a small slice of our assets to obtain considerable peace of mind. Heck, I've made speculative investments also with a small slice of our assets, most of which have ended up doing very well and a few which have bombed. PV is not speculative, and it is an exchange of money for something of solid, long term value.
 
  • Like
Reactions: woodgeek
Indeed. As a place to park value... inflation+1.5%/yr is better than cash and better than gold for the last several years.
 
Very much how I look at my system too. I look at as.. If everything goes to pot.. what have I got to spend to keep my home running.

With biodiesel to drive, wood to heat, and solar PV... the answer is.. not much!

JP
 
Today, Oct 28, is the one year anniversary of my system. The 26 micro-inverters report total output of 8965 kwh. The production meter at the house reports total 8880 kwh. I'm assuming that the 0.9% difference is caused by line loss over the 280 feet of underground cable between the panels and the house and/or meter tolerance. Following the end of October I will have a more complete report and analysis of the first year of operation, with which I have been very satisfied.

Many thanks for posting the years data. It is of great value to a solar wannbe like me to see how an actual system performs.
It is also very interesting to see the real world effects of cloudy days, hot summer days etc. etc.
Your efforts are much appreciated.
 
JP11, like you I heat with wood, no electricity required for the house. And with my excess PV credits not only is our house now energy NetZero, but also my shop.

Redbarn, here is a record of October production. You can see how low production can go with heavy cloud cover; also how high with a sunny day. October was running +100% until the last few day of heavy cloud cover.

upload_2014-11-2_8-44-24.png

I am happy that this is helpful. After one year of daily record keeping, I do not plan to continue that any longer. I will be watching for winter production though to see if on clear, cold days production gets into the high 40kwh range like it did this last winter. The all time high was 48kwh on one day, about 5 days at 47 kwh, and a fair number in the 42-46 kwh range. My highest day of non-winter production was 43 kwh, not many days over 40 kwh, and quite a few days in the high 30 kwh range.
 
jebatty.. how are you capturing the data?

I can go online and see real time, or historical. I push a button and get a CSV dump of each day of the month. I then paste into a spreadsheet. I'm still tweaking it.. but here it is. oops.. won't let me post XL

JP
 
For this first year, because I wanted to have an accurate baseline for the future and also to better understand my system, I physically read the meters every day: 3 utility meters for reduced rate interruptible, general, and buy-back, and then my own meter for production. For some brief periods when I was gone for several days I averaged the meter readings over the period.

The daily record has been very helpful to fully understand the impact of snow cover, shading, cloud cover, and soiling of the panels. As it has turned out, reduced output from soiling so far has not resulted in a measurable reduction in output. Since my array is ground mount, it is easy to do and I have regularly cleared snow from the panels during the winter.

The Aurora microinverter website collects data on total output with a reading every 15 minutes. The website also shows the curve for the day. This can be downloaded in a csv text file which can be read into a spreadsheet, although I have a separate graphing program which I use on occasion. And the website similarly provides 7 day, 30 day, 12 month, week to date, month to date, and year to date csv data and charts, as well as lifetime output. All of this data can be viewed and downloaded for past periods as well. The website then also shows all the panels with the output of each panel as of the last reading.

The website collected data is at the array itself. As I have learned, the meter reports on output are about 99% of the array output data. I attribute this difference to line loss over the 280 feet between the array and the meter and/or meter tolerance. At the array July was the month of highest output, at 1,077 kwh (1,067 meter) and December was the lowest at 268 kwh (268 kwh meter). Mar, April, May and June were all in the 900-999 kwh range; February, August, September and October were all in the 700-899 kwh range; January was in the 400-499 kwh range; November was in the 300-399 kwh range; and December was in the 200-299 kwh range.

In addition, I can visually see instantaneous output by panel over an ethernet connection to my computer. This output also includes total array output since installation, CO2 avoided, and the status of each panel. There have been very uncommon error reports on a panel, and these have been easily cleared with a reset. The errors have related mostly to the grid being outside of the parameters (I remember one occasion grid voltage was too high), or a communication error with a panel. Wifi is available to do this as well, but my panels are too far away for a wifi connection.

The only issue that I have had that was not easily corrected is that in very cold weather (roughly -15F and below) the ethernet monitoring device (CDD) will not operate. The CDD is spec'd to operate down to -5F. This does not affect panel performance or website collection of data, only the ability to see instantaneous panel performance. I have the CDD installed in an outdoor plastic electrical box, and yesterday I just completed installing in the box insulation and a snap thermostat to light a 4 watt light bulb in the box which should provide enough heat to keep the box interior warm and prevent this issue during the coming winter.

A summary perspective: it is helpful but not necessary to be "handy" with electricity and mechanics in owning a PV system, just like it is helpful to be "handy" to tackle the myriad of other maintenance issues in owning a home and operating a household. My system was professionally designed and installed in a turn-key operation. The designer has remained available to answer the few questions that I have had. The installer has not needed to return to repair or otherwise fix any problem with the system during this first year. Maybe best of all, my utility likely will be sending me a check this spring to pay me the excess credits I have accumulated and which were not used up over the winter. C'est la vie!
 
I've had just a couple of 'communication' issues as well. One of the inverters will occasionally just not report. I've gone as long as 3 days. It does however come back online, and will then go back and fill in all the data graphs on what it was doing back then. Must be a descent amount of onboard memory on the inverters.

I haven't been thru a winter yet. Inverters for mine are inside the barn. It's insulated, but unheated. We'll see.

JP
 
Just noticed that "views" now are over 10,000. Either my periodic posts have been very funny or actually helpful to others considering PV. Hope both are true.