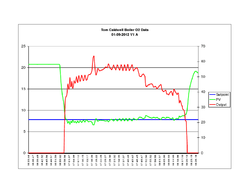
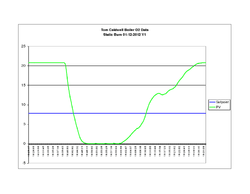
not your grandpa's garn graphs

  • Active since 1995, Hearth.com is THE place on the internet for free information and advice about wood stoves, pellet stoves and other energy saving equipment.

    We strive to provide opinions, articles, discussions and history related to Hearth Products and in a more general sense, energy issues.

    We promote the EFFICIENT, RESPONSIBLE, CLEAN and SAFE use of all fuels, whether renewable or fossil.
Status
Not open for further replies.

TCaldwell

Minister of Fire
the 01-09-12 trend consists of 100lbs mixed cordwood,with o2 control the 01-12 12 trend is 60 lbs mixed cordwood with no o2 control. quite a contrast!
 

Attachments

  • O2 graph.png
    O2 graph.png
    10.6 KB · Views: 598
  • stock burned.png
    stock burned.png
    6.9 KB · Views: 541
Looking for continuing info. Are you able to monitor other emissions during the course of an O2 controlled burn vs no O2 control? such as CO, CO2, etc.? And output during these burns? How are you measuring output? This is very interesting stuff.
 
jim, damper output is the red line on the o2 graph, dampers are fixed open for the static burn, co2 can be calculated from the o2, I am going to run some spot checks with the testo portable fluegas analyser next weekend for the other criteria on the o2 burn.
 
Status
Not open for further replies.