
I had the opportunity in March 2010 to measure performance of a Garn WHS3200 under conditions which tested its full capacity. The Garn was installed in the summer of 2009 to be available for the 2009-10 heating season. The Garn replaced existing LP boilers, which were left in place to provide backup heat. The facility being heated is 52,000 square feet and is located in north-central Minnesota. The facility also installed a Wood Gun E500. I could not make similar performance measurements on the Wood Gun due to unusually warm weather in March and after which did not permit continuous operation of the Wood Gun without extensive idle cycles. Had weather been colder, I also could have made measurement which tested the full capacity of the Wood Gun. Those measurements will have to wait for next heating season.
The facility heat emitters mostly are fan-coil units. These units are designed to operate with hot water supply in the 160-180F range. During “warmer” winter periods, supply as low as 140F can reasonably meet system demand.
Garn does not provide a BTUH output rating. Garn advertises the WHS3200 to have a Burn Rate of 950,000 BTU/H. Literature provided by Garn states that “... approximately 97% of the wood is converted to energy and 87% of that energy is stored for use.” This might be interpreted to mean that the Garn should be able to provide approximately 800,000 BTUH output, although experience reported by other Garn users in their posts suggests that the advertised “burn rate” is a good measure of expected output and in fact may be conservative.
SUMMARY. Based on my measurements, under full output demand conditions, the Garn was able to provide about 375,000 BTUH continuous average output, or somewhat less than 40% of the “burn rate.” In follow-up discussions with Garn, Garn has advised that the most efficient discharge temperature of the WHS 3200 is about 130F, and that efficiency would decline substantially at discharge temperatures above 140F.
DATA. Data was collected from 8:44 pm on March 19 to 10:50 am on March 20. 2010. Dallas DS18B20 sensors were fixed to the piping under insulation on the inlet and outlets of both Sides A and B of the plate heat exchanger interfacing the Garn to the system. The heat exchanger was sized based on recommendations from Garn. Temperatures were logged at the rate of 46 readings per minute, and then reduced to one reading every five minutes. The results are shown on the two charts.
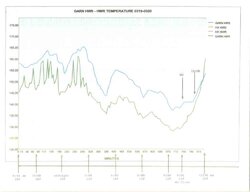
GARN SIDE OF THE HEAT EXCHANGER. The upper [blue] line is the temperature of the hot water from the Garn entering the heat exchanger. The lower [green] line is the temperature of the water leaving the heat exchanger and returning to the Garn. The upward spikes in the lower [green] line indicate periods when the system was not demanding heat. The areas of wide spread between the upper and lower lines indicate times when heat is being sent to the system.
The chart evidences when wood fuel was added to the Garn. This is shown by the large upward slopes in the upper [blue] line (rising temperature).
The chart shows by way of the lower [green] line spikes that at outside temperatures between 28F and about 21F, and Garn hot water supply temperatures between about 153F and 165F, the Garn met the heat demand from the system. No lower [green] line spikes appear after outside temperatures dropped below 21F, and after Garn hot water supply temperature dropped below 150 to 155F. This means that the system continued to demand heat which the Garn was unable to satisfy.
When the operator arrived at the facility around 6:00 am on March 20, he noted that system hot water supply temperatures were low, and he added wood to the Garn in an attempt to raise the hot water temperature to meet system heat demand. Following a brief and small rise in Garn hot water supply temperature, the Garn hot water supply temperature continued to drop. The system was pulling more heat from the Garn than the Garn was supplying from the burning wood.
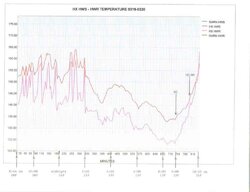
To remedy the insufficient hot water heat supply, the operator then fired the Wood Gun at 9:00 a.m. System hot water temperatures immediately started to rise, rising to the point that by about 10:00 a.m. hot water supplied by the Wood Gun to the system was hotter than the hot water being supplied by the Garn, as evidenced by the lower [green] line rising above the upper [blue] line. As system hot water temperatures had risen and outside temperatures also were rising, the Wood Gun was allowed to burn out its load of wood, and the Garn again took over supplying heat to the system.
Except for about a one hour period when the Garn supplied hot water just under 140F, the facility operated the Garn above the efficient discharge temperature advised by Garn.
The period from 4:00 to 9:00 am provides information on Garn BTU/H input to the heat exchanger. At a calculated flow of 75 gpm on Side A of the HX, BTU/H = 500 x 75 x ▵T (temperature change). ▵T is close to 10F or a little better average during this period. Therefore, output by the Garn into the HX is about 375,000 BTU/H. This must be regarded as somewhat approximate, as the flow rate is derived from calculated pump head and the pump curves, and the ▵T is an observation from the graph.
The facility heat emitters mostly are fan-coil units. These units are designed to operate with hot water supply in the 160-180F range. During “warmer” winter periods, supply as low as 140F can reasonably meet system demand.
Garn does not provide a BTUH output rating. Garn advertises the WHS3200 to have a Burn Rate of 950,000 BTU/H. Literature provided by Garn states that “... approximately 97% of the wood is converted to energy and 87% of that energy is stored for use.” This might be interpreted to mean that the Garn should be able to provide approximately 800,000 BTUH output, although experience reported by other Garn users in their posts suggests that the advertised “burn rate” is a good measure of expected output and in fact may be conservative.
SUMMARY. Based on my measurements, under full output demand conditions, the Garn was able to provide about 375,000 BTUH continuous average output, or somewhat less than 40% of the “burn rate.” In follow-up discussions with Garn, Garn has advised that the most efficient discharge temperature of the WHS 3200 is about 130F, and that efficiency would decline substantially at discharge temperatures above 140F.
DATA. Data was collected from 8:44 pm on March 19 to 10:50 am on March 20. 2010. Dallas DS18B20 sensors were fixed to the piping under insulation on the inlet and outlets of both Sides A and B of the plate heat exchanger interfacing the Garn to the system. The heat exchanger was sized based on recommendations from Garn. Temperatures were logged at the rate of 46 readings per minute, and then reduced to one reading every five minutes. The results are shown on the two charts.
GARN SIDE OF THE HEAT EXCHANGER. The upper [blue] line is the temperature of the hot water from the Garn entering the heat exchanger. The lower [green] line is the temperature of the water leaving the heat exchanger and returning to the Garn. The upward spikes in the lower [green] line indicate periods when the system was not demanding heat. The areas of wide spread between the upper and lower lines indicate times when heat is being sent to the system.
The chart evidences when wood fuel was added to the Garn. This is shown by the large upward slopes in the upper [blue] line (rising temperature).
The chart shows by way of the lower [green] line spikes that at outside temperatures between 28F and about 21F, and Garn hot water supply temperatures between about 153F and 165F, the Garn met the heat demand from the system. No lower [green] line spikes appear after outside temperatures dropped below 21F, and after Garn hot water supply temperature dropped below 150 to 155F. This means that the system continued to demand heat which the Garn was unable to satisfy.
When the operator arrived at the facility around 6:00 am on March 20, he noted that system hot water supply temperatures were low, and he added wood to the Garn in an attempt to raise the hot water temperature to meet system heat demand. Following a brief and small rise in Garn hot water supply temperature, the Garn hot water supply temperature continued to drop. The system was pulling more heat from the Garn than the Garn was supplying from the burning wood.
To remedy the insufficient hot water heat supply, the operator then fired the Wood Gun at 9:00 a.m. System hot water temperatures immediately started to rise, rising to the point that by about 10:00 a.m. hot water supplied by the Wood Gun to the system was hotter than the hot water being supplied by the Garn, as evidenced by the lower [green] line rising above the upper [blue] line. As system hot water temperatures had risen and outside temperatures also were rising, the Wood Gun was allowed to burn out its load of wood, and the Garn again took over supplying heat to the system.
Except for about a one hour period when the Garn supplied hot water just under 140F, the facility operated the Garn above the efficient discharge temperature advised by Garn.
The period from 4:00 to 9:00 am provides information on Garn BTU/H input to the heat exchanger. At a calculated flow of 75 gpm on Side A of the HX, BTU/H = 500 x 75 x ▵T (temperature change). ▵T is close to 10F or a little better average during this period. Therefore, output by the Garn into the HX is about 375,000 BTU/H. This must be regarded as somewhat approximate, as the flow rate is derived from calculated pump head and the pump curves, and the ▵T is an observation from the graph.
")