Ground-mount 9Kw solar install beginning today

  • Active since 1995, Hearth.com is THE place on the internet for free information and advice about wood stoves, pellet stoves and other energy saving equipment.

    We strive to provide opinions, articles, discussions and history related to Hearth Products and in a more general sense, energy issues.

    We promote the EFFICIENT, RESPONSIBLE, CLEAN and SAFE use of all fuels, whether renewable or fossil.
It's difficult to give an answer on what to expect. Your latitude is important and yours is different than mine. Local weather patterns also play a big role. What is the wattage rating of each of your panels?

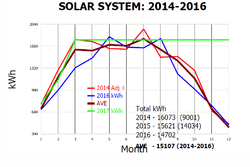
Look for others with PV in your area and start to talk to them about what their experience is. I have a friend about 17 miles from me with a nearly shade-free ground mount 8kW system, mine also is nearly shade-free, and we compare frequently, but often cloud cover is different for him than for me. On clear days that cover our whole area we get the best comparisons.
 
Fwiiw.. my latest 3 kw just came on line, bringing me to 7.6 kw ( a little less ac since I use enphase microinverters ..18 m215 and 10 shiny new s280)

I'm getting ~49 kwh on the sunny cold days up here on the Ma NH border
 
This makes me question whether my setup was done right. Your 7.6kW system generates 49 kwh on a good winter's day. The best my 9kW system has done was 44kW this winter so far.
 
I wouldn't jump over the cliff yet. Way to many things can impact solar production between specific sites even without taking into effect yearly local climate variation. Panel angle is big one. Someone with a roof mount is pretty well stuck with whatever angle they already have and that can mean a steeper than optimal summer angle that boosts production around this time of year. Your system being ground mounted may be more ideally angled so that you get more total power year round. I have a roof mount that is far too flat for this time of year so its production is lower than my pole mount. As the days start to get longer into summer my roof mount starts to catch up and exceed the pole mount although some of that gain is offset by heating as the roof mount definitely is hotter than the pole mount which reduces panel efficiency.
 
  • Like
Reactions: 7acres
This makes me question whether my setup was done right. Your 7.6kW system generates 49 kwh on a good winter's day. The best my 9kW system has done was 44kW this winter so far.

Here's a picture of peak power on St Patrick's day. The 10 expansion panels are 305 W connected to s280, the roof panels are 250 W connected to M215 microinverters ( which put out up to 225 W). The system is putting out 6.81 kW, which is close to the maximum, given the microinverter limits, of 6.85 kW.

I only get peak power during the cold March months. The smooth power curve shows it was sunny all day. For the day I had a total total energy of 49.2 kWh ( Also shown is a snapshot of energy per panel for the day.. the low energy panels near the top of the roof are near the chimney and are shaded in the morning and afternoon respectively)

Just a note.. some say microinverters are really not needed if shading is not an issue.. I find them invaluable in figuring out what is going on with my system

energy.png power.png
 
That's pretty cool you can see details for each individual panel.
 
That's pretty cool you can see details for each individual panel.

Cool indeed.. you can play the power view as a video and watch the panels change color as the sun comes up, or as the chimney shades them. You can do it by day or by week

I originally got it because I wanted to be able to track which panel went bad, if any, on the roof. I kept it for the ground mount because I expected some shading in the morning on the bottom row, but mostly because I liked the interface so much
 
Here is a slide with lifetime energy. The system grew with time.. first 10 (250 W) panels went in ~ December 2012, the next 8 (265 W) on June 2013, the final 10 (305W) on March 2017

I post the slide so you can see how energy varies during the year. From June 13 to early march 17 the system was 4.6 kW DC (4.05 kW AC because of microinverter limits) ). Peak energy per day is ~ the beginning of May and is ~33 kWh / day for the 4.6 kW roof system, this peak energy is pretty consistent from year to year

You'll probably see something like this as you track your energy over the course of the year
 

Attachments

  • energy-lifetime.png
    energy-lifetime.png
    36.5 KB · Views: 208
Just a note.. some say microinverters are really not needed if shading is not an issue.. I find them invaluable in figuring out what is going on with my system
I agree. I'm not sure how easy it would be to identify under-performing panels with a string inverter installation.

I have Aurora Power One micros, and info is available similar to that which georgepds gets with Enphase. Here is a screen shot of March 15 production, my highest day so far in 2017: 84.76kWh, 1.84kWh/panel average. The 26 panels to the left are 265W, the 20 panels to the right are 270W. The micros are rated at 250W, but actually produce sustained output up to about 265W on cold, clear days in April-May.

upload_2017-3-21_5-2-0.png
 
Last edited by a moderator:
I agree if someone without peak hour shading issues (usually 9 AM to 3 PM) wants to see panel by panel performance, cant beat microinverters or Solar edge Optimizers. On the other hand most folks really don't care once the system has been in operation for a year or so. Realistically barring bad installation or vandalism, PV panels wired in strings are pretty darn reliable, the vast majority of the time the micro inverter monitoring software is flagging a problem its identifying which micro inverter died. Good to know if someone elected to go with micros or optimizers but why not cut out the most failure prone part of the loop and get rid of the micro inverters or optimizers ?.

I went through the economics on micros on another thread (post #68 https://hearth.com/talk/threads/get...r-potential-with-aerial-imaging.160937/page-3) and seem to have come up on a similar system that the micros add $2000 to the cost of a system. Lets use 20 cents per KW for power pricing, that's 10,000 Kilowatts of production that is going to have to be justified in extra production.

The OP has two SMA string inverters that have 3 MPPT inputs available each, given the number of panels I would guess they used 2 on each string inverter. I haven't seen the SMA monitoring software but expect he can see the performance of each string. Pretty easy to compare all four and if one is performing poorly its time to go looking for issues on that string. Odds are the string is disconnected and the output will be zero. If there is a problem with a panel, the easiest way I have heard of is wait until a cloudy day and shine a strong focused light on each panel in the string and have someone record the wattage increase at each panel. The panel with an issue will be the one with least wattage rise. Unless the panel is defective the other rare cause is a smoked diode which on most panels is not readily replaceable. All the micros and optimizers do is electronically jumper out the bad panel and let the rest of the string produce power.

So barring shading issues, the OPs system most likely worst case loss is 25% of his daily output. Lets assume 40 kwh per day, so 10,000/40*.25) which is about 1000 days where an optimizer would help if a string were out before the extra cost was justified. The trade off is proprietary equipment and wiring from two companies with significant financial issues that could take them out of the picture soon.
 
Regarding microinverters

Yes they cost more, and yes solar is pretty reliable..but a few thoughts

Most of us don't do solar because of finance, though it is becoming more reasonable to do so

Next, for those of us with bad knees and a roof mount... consider the bad panel...You have to go up on the roof and
one by one dismount the panel and test the output ... Now consider that task in the dead of winter

Finally.. it's just fun to look at the output and figure out what's happening, even four years into ownership.

Or... you can count your nickels.. until that rare panel fails on your roof.. then break out the harness and cleats
 
The OPs install is a ground mount.

At some point if the micro is bad which is far more likely than a panel, someone still has to climb on the roof to replace either the panel or the microinverter/optimizer. In either case the panel needs to be removed.
 
The OPs install is a ground mount.

At some point if the micro is bad which is far more likely than a panel, someone still has to climb on the roof to replace either the panel or the microinverter/optimizer. In either case the panel needs to be removed.

And I bet he'd like to know right now if it is a bad panel, or shading, or cloudy days, or any of the other questions you can answer with a microinverter.

But didn't you propose somewhere that at most it is a 25% loss...after spending all that cash on a new system..I know I'd like to know more exactly what's going on

As to microinverter reliability you have mentioned that several times, but should one go out... you know which one...

And in my personal experience, I've never had a microinverter fail, but I did have a string inverter fail. Guess what... replacement cost was higher than a microinveter.. and the whole shebang went down, not just one panel.

Gradual reduction of system performance with single component failure is an important part of system design. You can accomplish that goal with microinverters, but not with a single string inverter
 
I've got two Sunny Boy 5.0-US inverters, one for each string.

The PVWatts calculator says my system should produce almost exactly what I'm seeing right now. So I'm not worried. I think peakbagger is spot on as far as what to expect from different systems designed around different situations.

As far as inverters go, I'm just happy Sunny Boy made my units in the color GRAY instead of bright RED like their previous models. What an eyesore that would have been. ==c
 
....

The OP has two SMA string inverters that have 3 MPPT inputs available each, given the number of panels I would guess they used 2 on each string inverter. I haven't seen the SMA monitoring software but expect he can see the performance of each string. Pretty easy to compare all four and if one is performing poorly its time to go looking for issues on that string. ....

Good point.. OP is that the case?
Can you see if one substring is under performing?
Can you track it by hour, or just by day?

Merging multiple panels into substring will obscure the problem, merging data into daily output will obscure it more.. but it is still worth looking into..

Here is an example.. if you look back at my ground panels the bottom row produces consistently less than the top on the daily energy chart. (2.03 instead of 2.10kWh, per "string" 10.5 kWh vs 10.15 kWh)) . If I playback the data I can see that the power is just a bit lower early morning before 8 (house shading) . Nothing I can do about it (I'm not going to tear down the house, and I'm not going to remount the panels). I'll just accept the lower .
performance.. but I know exactly why it's there

power 8 am.png
 
Good point.. OP is that the case?
Can you see if one substring is under performing?
Can you track it by hour, or just by day?

Merging multiple panels into substring will obscure the problem, merging data into daily output will obscure it more.. but it is still worth looking into..

Here is an example.. if you look back at my ground panels the bottom row produces consistently less than the top on the daily energy chart. (2.03 instead of 2.10kWh, per "string" 10.5 kWh vs 10.15 kWh)) . If I playback the data I can see that the power is just a bit lower early morning before 8 (house shading) . Nothing I can do about it (I'm not going to tear down the house, and I'm not going to remount the panels). I'll just accept the lower .
performance.. but I know exactly why it's there

View attachment 196323

I can track it by hour. I can see the exact energy production on each inverter's display panel. They are usually very close. For instance, right now:

Front string:
P: 2430W
E-Total: 655.5kWh

Back string:
P: 2435W
E-Total: 670.8kWh
 
Here's my PVWatts report:

upload_2017-3-21_12-18-43.png
 
Last edited by a moderator:
I've got two Sunny Boy 5.0-US inverters, one for each string.

The PVWatts calculator says my system should produce almost exactly what I'm seeing right now. So I'm not worried. I think peakbagger is spot on as far as what to expect from different systems designed around different situations.

As far as inverters go, I'm just happy Sunny Boy made my units in the color GRAY instead of bright RED like their previous models. What an eyesore that would have been. ==c


Glad you figured it out.

I'm just curious about angle of panels. From what I understand, most fixed installations have optimum performance near spring.. Did you play at all with the panel angle in PV watts to see if annual ( or spring) production would be more or less?

--g
 
The above report is based on my 30 degree angle. I just plugged in 20 degrees to see what that would produce. Result: 12,769kWh. So my 30 degree angle is better. 40 degrees produces 12,909kWh; slightly less as well. 35 degrees produces 12,989kWh; super close, but still less. It looks like 32 degrees would give me 13,000kWh which would be an improvement. But now we're probably splitting hairs. That was a fun exercise though.
 
Got our first all solar electricity bill. $38.28/mo ::-) Woo Hoo!
 
I remember my anxious/excited wait for the first all solar electric bill which would have arrived in December 2013. My amazement not only of producing electricity without doing anything never ceases, but also getting a monthly "dividend check" from a purchased product, rather than incurring a monthly expense, bring great satisfaction. Also, can't overlook the many breaths of absolutely clean fresh air the PV provides every day.
 
  • Like
Reactions: 7acres
My system for Jan-Mar 2017 is in near record-breaking kWh territory. The graph (red-2014) shows highest production, (blue-2016) lowest production, (brown) three-year average production, and (green) 2017 Jan-Mar production. The first six days of April remain at record-breaking levels.

upload_2017-4-7_5-4-57.png
 

Attachments

  • upload_2017-4-7_4-49-0.png
    upload_2017-4-7_4-49-0.png
    27.4 KB · Views: 181
Last edited by a moderator:
To paraphrase John Hannibal Smith (The A Team) Don't you just love it when a plan come together!
 
  • Like
Reactions: NickDL and 7acres
Got our first all solar electricity bill. $38.28/mo ::-) Woo Hoo!

My projected bill this month is $35. Not bad considering we've had temps over 90° already.
My worst electric bills last year were two back to back months of $63. :rolleyes:
My worst bill the previous year was $85. (PV array went online 8/2013)
Gone are the days when my August/September electric bill was >$150, and sometimes over $200. :ZZZ
Before solar went on my roof, I used to have ~6mo/yr with bills >$100 in this all electric house. Now, my roof is shaded by the array, and the array pays to run the A/C system.

To paraphrase John Hannibal Smith (The A Team) Don't you just love it when a plan come together!

Plan... I just love it when the sun comes up!

Microinverters: I can watch the shade from the royal palm tree in my neighbor's yard east of my array tracking across the panels in my array every morning. It clears up by 11AM.
 
My monthly bill is about $12.50 a month to cover transmission and distribution plus an arguably illegal state tax on my net metered power coming back from the grid. It might be 35 cents a month when I am pulling back a lot of power to heat my house in the winter but not worth suing. I sell SRECs which usually net about $200 a year so that offsets the monthly utility fees (if I was in Mass I would be getting about $1,200 a year for SRECs).