free75degrees said:
nofossil said:
I'm impressed! From a software point of view, that might even be more complicated than what I'm doing, and that takes some serious work.
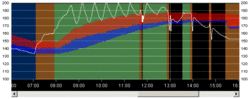
I've not done as much in Perl, and I'm using the jpgraph package to create my graphs. Still working on finding the best presentation for the data. That graph looks nice.
Thanks, a compliment from the guru means a lot. I would have never gone this route without having been inspired by your system.
The software isn't too complicated. Perl is very compact and the script that runs once a minute and sets the system state is only about a page of code. The C code to read the sensors and set the relays is probably a few pages. The hardest part by far was getting the sensors to work and to work with long wires. I gave up on putting all of the sensors on one bus and am now using a dedicated I/O for each sensor. This may be better anyway because it saves cpu time because I don't have to send the unique rom code for each device and read out the temps one at a time.
Very Nice Job!
I have been inspired by both of you, The thread on the 1 wire sensors is what really got me thinking that this is something I could do without much hardware though.
So I bought a ds9490 USB adapter and started playing, and found out that I am indeed no programmer. LOL
After thoroughly confusing myself and being disappointed I decided to go back to the library and trade in the C,C++, and java books(yes I read some of each,had to see what its all about.talk about brain overload) for
A Visual Basic book(I know, kid stuff) and now things are starting to make sense anyway.
I started with some of the software examples from dallas and have had great success after learning the basics. I found that with parasite power readings were a bit erratic and read that external power may help at higher temps, It did. Temp conversion seemed to take forever with six sensors until I discovered you can convert all at once and then read them.
Now I am not ready for graphs and logging yet but this is what I have so far. Sensors in place(system is currently controlled with aqua-stats and relays) and a few ds2406 switches on a breadboard with LED's for testing.
Question I have, how often should I read the sensors every 1 second, 5 , 30? I think I read Nofossil was reading every second, If I do skip rom and convert all at once they can be read every second but this seems like overkill.
Next Q you guys are using DIO boards to drive relays, anyone want to comment on the reliability of using 1 wire switches(such as ds2406,2408) for driving relays?(with a buffer of some sort)
I am running this on a windows machine that is always on anyway. It may be the weak point of the setup but it runs for months without a reboot and then usually only for updates so it is stable.
I already have aqua-stats in place that could act as a fail-safe, May not be efficient but would keep from freezing or boil-over
If nothing else I have educated myself so it won't be for not. I could very easily be talked into an NFCS!! ;-) need any beta testers?

")