PVoutput solar website.

  • Active since 1995, Hearth.com is THE place on the internet for free information and advice about wood stoves, pellet stoves and other energy saving equipment.

    We strive to provide opinions, articles, discussions and history related to Hearth Products and in a more general sense, energy issues.

    We promote the EFFICIENT, RESPONSIBLE, CLEAN and SAFE use of all fuels, whether renewable or fossil.

Brian26

Minister of Fire
Sep 20, 2013
694
Branford, CT
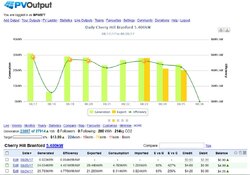
Anyone else have their panels on PVoutput? I just put mine on there. What an awesome site. I have been having issues with my Efergy consumption monitor so the data is not 100 percent accurate. What a cool site to see the data on your solar production. The cool and sunny weather here in New England has been awesome for prouduction.

https://www.pvoutput.org/list.jsp?userid=60553

pvoutput.JPG
 
Last edited by a moderator:
So the panels are not actually putting out more than their rated output on good days (as the graph depicts)?
 
So the panels are not actually putting out more than their rated output on good days (as the graph depicts)?

Correct. I will see peak spikes of around 4800-5000 kwh but in full sun they don't put out their full power. I think there is a standard 20% loss on efficiency.
 
20%is huge..


Panel output degrades with increasing temperature but not that much. One problem might be shade... or even degradation of a single panel.

There's lots of questions to ask... like what's the panel orientation

Do you have a way to track individual panels? I do it with my enphase software. But I hear other vendors provide means to do this tracking
 
Correct. I will see peak spikes of around 4800-5000 kwh but in full sun they don't put out their full power. I think there is a standard 20% loss on efficiency.
Welcome to the atmosphere here on planet earth. As you move away from the equator, your sunshine must travel through more of it to get to your panels, and the more pollutants everyone on the planet lofts up into the atmosphere, the less your panels will put out. Heat is also the nemesis of your PV array. A cold clear day close to the spring equinox and close to freezing temperatures will beat the overall output on a long hot summer day.

Lost efficiency depends on so many variables, it's not even funny: Wire sizing, panel temperatures, air flow behind the panels, length of wire runs, accumulation dust/pollen/mold/mildew on the panel glass, site factors like tilt and orientation variation from grid due south (not magnetic south). Then we can toss in inverter efficiency, optimizer efficiency, panel to inverter mis-match.

Long ago, I gave up watching for a day with a 4,400W output at the top of my bell curves. Give me a day with <23kWh collected, and I'm happy as a clam...

To answer your original question about using PVOutput: No, I'm not. I might consider it when I get my second array up and running at 45.8°N...
 
not on that site, but my array is a 7.5kw setup and the most I ever see is about 6k then the panels get too hot and you can watch the numbers drop, as the sun comes directly perpendicular to the panels (11:20 ish or so for august)....my biggest problem is after three years I think I need to clean my panels, but there is no safe way to do it that I have figured out anyways. roof is too high up, and not enough room to walk on either side of the panels safely. my titl should have been enough for the panels to self clean, but you never know.
 
Last edited by a moderator:
Yes, we usually see a 15-20% drop from max potential of our array. High latitude doesn't help. In our case though the point is moot. Our inverter output is slightly less than full array capacity anyway so we look at the day's generation as well. Unfortunately that is now declining rapidly due to a lower angle sun and shading and will continue to do so. Starting tomorrow it doesn't look like a sunny week.
 
Do you have a way to track individual panels?
Display of individual panel output is useful. It allows easy ID of under-performing panels. I have checked total per panel output of my system, and all panels are within +/- 2% of the average per panel output of the system. This seems to be very satisfactory.

My 12.3kW system has Aurora Power One micros, and the software displays graphically individual panel output, also allows downloading individual panel data as well. October 10, 2017, was a very good day. Peak output was10,044W,with sustained plus 10,000W for one hour. Per panel output was on average 220W, vs panel ratings of 265W and 270W. At panel rating each panel would be producing on average 267W. The micros are rated at 250W, 260W maximum output, and 265W maximum usable power.

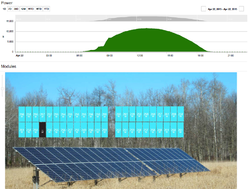
At 250W/panel, output would be 11,500W, at 260W/panel output would be 11,960W. On April 22, 2015, output over 11,500W was sustained for one hour, with 11,584W being the maximum reached during this hour. One micro had failed at this time, the only micro failure I have had. If it had been producing, average panel output would have been 255W. The picture displays the output curve for this day. Total day production was 87.02kWh. The highest daily production I have seen with my system was just over 89kWh.

April and May provide the highest daily output of my system. Low humidity, low dust/pollen/smoke in the air, and cool temperatures all combine to provide high output.
upload_2017-10-17_4-57-48.png
 
Last edited by a moderator: